5 Content Performance Metrics Every Writer Should Understand (But Most Never Check)
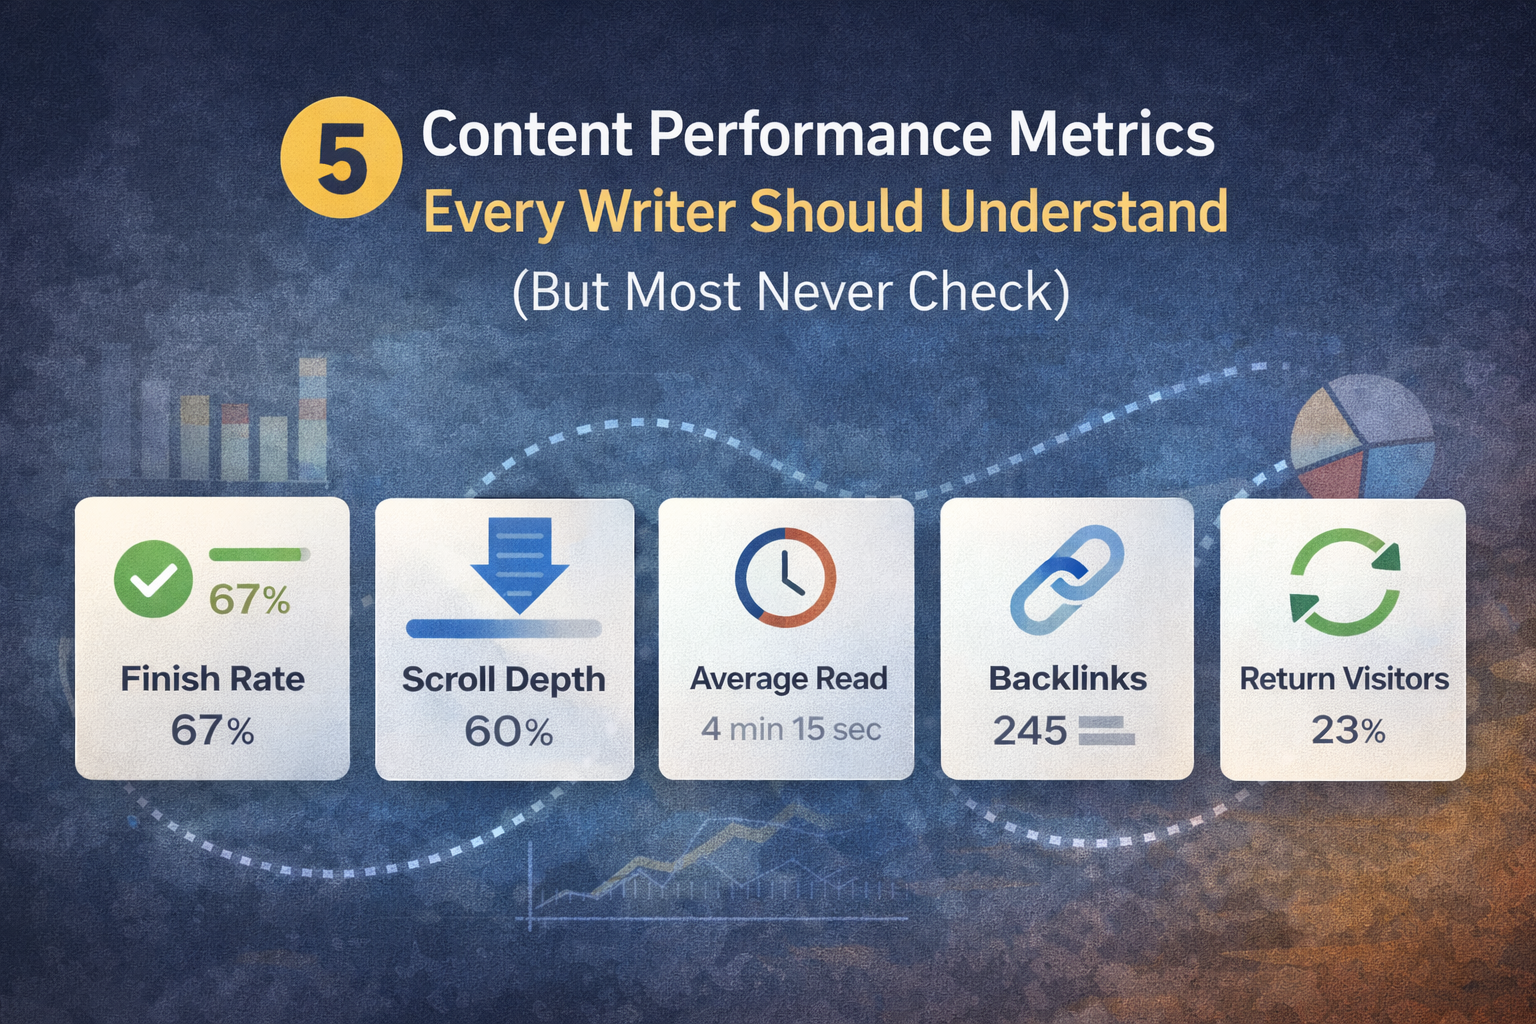
Most writers only look at pageviews. Here are the 5 content performance metrics that actually reveal whether your writing is landing — explained in plain English with benchmarks you can use today.
Ask most writers how their content is performing and they'll tell you one of two things: how many pageviews their best post got, or that they don't really check. Both answers are a problem.
Pageviews tell you one narrow thing: how many times a page loaded. They say nothing about whether anyone read past the first paragraph, whether readers left satisfied or frustrated, whether the piece is building any long-term momentum, or whether anyone will ever come back.
The metrics that actually answer those questions exist. They're accessible. They're not complicated once you know what you're looking at. They're just almost never talked about in terms that make sense to writers — which is why most writers never check them.
This article covers the five content performance metrics that matter most for writers, bloggers, and content creators. For each one, you'll get a plain-English explanation of what it measures, what a healthy number looks like, and what to do if yours is off.
Metric #1: Read Completion Rate
What it is
Read completion rate measures the percentage of visitors who make it all the way through a piece of content from start to finish. It's the most direct signal of whether your writing is genuinely holding attention — not just attracting a click.
Most analytics platforms don't surface this number by default, which is a big part of why most writers never see it. But it's trackable through scroll depth data, which most modern analytics tools do collect.
What the data says
On average, only 20% of readers finish a given article. The typical visitor reads just 25% of the content on any given page before leaving.
Only about 11% of readers make it to the bottom of a typical article published online — meaning if you're above that threshold, you're already outperforming most content on the internet.
What "good" looks like
A read completion rate above 25–30% is strong performance for most blog content. Above 40% is exceptional and indicates the piece is well-structured, clearly written, and delivering genuine value from beginning to end.
What to do if it's low
Start with your intro. The first 100–150 words determine whether most readers stay or go. A weak opening — one that summarizes what's coming rather than giving readers a reason to care — is the single most common cause of low completion rates. After that, look at your subheadings: readers skim ahead before committing to read, and vague or generic headings give them no reason to keep going.
Metric #2: Scroll Depth
What it is
Scroll depth tracks how far down a page a visitor actually scrolls, typically measured in percentage thresholds: 25%, 50%, 75%, and 100%. It's closely related to read completion rate but gives you something even more useful: a map of exactly where readers stop engaging.
If your read completion rate is low, scroll depth tells you where the problem is. That's the difference between knowing something is wrong and knowing what to fix.
What the data says
For blog posts and long-form content, a scroll depth of 60–80% is generally considered strong engagement. Anything below 40% warrants a close look at structure and content quality.
For a blog post, you'd ideally want most users to reach at least 75% of the page — that's typically where the conclusion, key takeaways, or calls to action appear.
What "good" looks like
The majority of your readers reaching the 50% mark is a reasonable baseline. Strong content sees 30% or more of readers reaching the 75% threshold. If users consistently drop off before 25%, the issue is likely in your opening section — the content is failing to pull readers in before they decide to leave.
What to do if it's low
Identify your exact drop-off point and treat it as a diagnostic. Common culprits: a dense, unbroken block of text that causes visual fatigue; a subheading that accidentally signals "we're almost done here"; or a shift in topic or tone that breaks the reader's flow. Small structural edits at the drop-off point often produce outsized improvements in overall engagement.
Metric #3: Average Read Time vs. Expected Read Time
What it is
Expected read time is calculated from your word count: divide it by 200–250 (the average adult reading speed in words per minute) to get a baseline. Actual average read time is how long people are genuinely spending on the page.
When you compare these two numbers, you get one of the most honest signals available about whether readers are truly engaging with your content — or passing through it.
What the data says
The average person spends just 96 seconds on a blog post, regardless of length. For a 1,500-word article — which should take around 6–7 minutes to read — that's an engagement rate of under 25%.
Reader engagement peaks for blog posts with a 7-minute read time, roughly 1,500–2,000 words. This appears to be the sweet spot between depth and accessibility for most audiences.
What "good" looks like
If your actual average time on page is at least 50–60% of your expected read time, readers are genuinely engaging. At 70–80%, you're seeing strong readership. If actual time is less than 30% of expected, readers are largely bouncing or skimming without engaging — and that's worth investigating.
What to do if it's low
The gap between expected and actual read time is usually explained by one of three things: a weak intro that causes early abandonment; dense, hard-to-skim formatting that creates friction; or content that doesn't match the reader's intent — they arrived expecting one thing and found another. All three are fixable, but you need the data to know which one you're dealing with.
Metric #4: Return Visitor Rate
What it is
Return visitor rate measures the percentage of your audience that comes back to read more of your content after their first visit. It's the clearest long-term signal that you're not just attracting one-time readers — you're building an actual audience.
A viral post can give you a spike in new visitors. A high return visitor rate tells you that your content is consistently valuable enough that readers seek you out again. Those are very different things, and only one of them compounds over time.
What the data says
Marketers who prioritize consistent blogging are 13 times more likely to see positive ROI — a gap driven largely by the compounding value of return audiences, not individual viral posts.
77% of the most successful companies consistently measure their overall content performance, compared to just 55.5% of minimally successful companies. The feedback loop — including return visitor data — is what separates them.
What "good" looks like
A return visitor rate of 20–30% is healthy for a growing content site. Above 35% indicates strong audience loyalty — readers are actively choosing to come back rather than just stumbling across your work again. Below 10% suggests that while you may be attracting readers, something about the experience isn't compelling enough to bring them back.
What to do if it's low
Return visitors are built through three things: a consistent publishing schedule (so readers know to come back), strong internal linking (so every article leads somewhere useful), and a clear, recognizable voice or focus area that makes your content identifiable. If readers can't easily describe what kind of content you produce or why they'd return, your return rate will suffer. A newsletter or email list is also one of the most reliable return-visitor engines available to independent writers.
Metric #5: Backlinks Earned
What it is
A backlink is a link from another website to a page on yours. When another writer, journalist, or publication references your work and links to it, that's a backlink. They matter for two reasons: they drive referral traffic directly, and they are one of Google's most heavily weighted signals for determining which content deserves to rank in search results.
Most writers never think about backlinks. That's understandable — they feel like an SEO concern, not a writing concern. But the content choices you make directly determine whether your work is the kind of thing other people cite and link to.
What the data says
95% of all web pages have zero backlinks pointing to them. The top-ranking page on Google has, on average, 3.8 times more backlinks than pages ranked 2–10.
Only 3% of content published online earns more than one unique backlink. Long-form content exceeding 3,000 words earns 3.5 times more backlinks than shorter articles.
What "good" looks like
For most independent writers and small blogs, earning even one or two quality backlinks per article is meaningful. Consistent backlink growth — even modest — compounds into improved search visibility over time. The goal isn't to go viral in the link-building world; it's to create content worth citing.
What to do if it's low
Write content that contains something citable: original research, a useful framework, a clear explanation of something confusing, or a well-sourced compilation of statistics. These types of content earn links naturally. Also consider adding internal links pointing to your strongest pieces — they don't generate backlinks directly, but they signal to search engines which of your pages matter most, which can improve rankings and, in turn, attract more external links over time.
How to Use These Five Metrics Together
Each of these metrics tells a different part of the story. Reading them together is where the real insight comes from. Here are a few common patterns and what they mean:
High scroll depth + low return visitor rate
Readers are finishing your content but not coming back. Your writing is engaging; your retention strategy is missing. Look at your newsletter sign-up, internal links, and publishing consistency.
Low read completion + short average read time
Readers are leaving early. The issue is almost always in the intro or the first major section. The headline may be attracting the wrong audience, or the opening isn't compelling enough to justify the time investment.
Good completion rate + zero backlinks
Your readers enjoy the content, but it's not positioned as a reference piece. Consider adding original data, more specific statistics, or a distinctive framework — something that makes the piece citable beyond just being a good read.
Strong organic traffic + low read completion
Search is sending you traffic, but the content isn't matching what those readers actually want. Check whether your headline and meta description match the experience the article delivers, and review whether you're targeting the right keyword intent.
The Honest Challenge: Getting These Numbers
Here's the part most analytics guides skip: actually getting these five metrics in a usable form is harder than it should be. Read completion rate requires interpreting scroll depth data and doing some mental math. Average read time vs. expected read time means pulling a number from your analytics tool, calculating your expected time from your word count, and comparing the two. Backlinks require a separate tool altogether. Return visitor rate is typically buried several levels deep in most analytics dashboards.
None of it is impossible. But all of it takes time, and the translation from numbers to meaning is still something you have to do yourself. That's precisely why most writers, despite having access to all this data, end up just checking pageviews and closing the tab.
66% of content marketers say they struggle with knowing where to allocate resources — a challenge driven directly by the difficulty of interpreting fragmented data across multiple tools.
The solution isn't more data — it's better interpretation. The writers who consistently improve their content performance aren't the ones drowning in dashboards. They're the ones who've found a way to get clear, plain-language answers to the questions that actually matter.
All Five Metrics. Plain English. No Dashboard Required.
Plattenite was built to make exactly these five metrics accessible to writers who don't want to become analysts. It tracks read time vs. expected read time, scroll depth and drop-off points, engagement patterns across your articles, and overall content performance — then explains what it all means in clear, written summaries.
No spreadsheets. No manual calculation. No stitching together multiple tools. Just a plain-English explanation of how your content is performing and what to do next, delivered on your schedule.
Start your free trial at PlatteniteKey Takeaways
- Read completion rate is the most direct signal of genuine engagement. Only 20% of readers finish the average article — if you're above that, you're ahead.
- Scroll depth doesn't just tell you that people are leaving — it tells you exactly where, so you know what to fix.
- Average read time vs. expected read time reveals whether readers are genuinely engaging or just passing through.
- Return visitor rate is the difference between attracting readers and building an audience. 20–30% is healthy; above 35% is strong.
- Backlinks are a signal of how citable your content is — 95% of web pages have zero. Writing something worth referencing changes the trajectory of your organic reach.
- Reading all five metrics together reveals patterns that no single metric can show on its own.